How to Perform Thermal Mapping and Balancing of Your Industrial Oven
Thermal mapping of an industrial oven is an important procedure to enhance your product in the cooking cycle.
Mapping and balancing your oven will help you troubleshoot product issues and improve product consistency, yields, and throughput.
It’s the not-so-secret step to ensuring your industrial oven produces the results you want.
In this article, we’ll walk you through how to conduct thermal mapping and balancing of your ovens.
What is Thermal Mapping?
Before we start, it’s important to understand what we mean by thermal mapping.
Simply put, thermal mapping is a process to detect & record temperatures at various points in the oven.
This process is done to:
- Detect hot and cold spots or zones inside the oven
- Analyze the change in temperature to enhance product quality
We recommend mapping and balancing your oven at least once a year.
Thermal Mapping Test Equipment
Two critical instruments are needed to perform thermal mapping:
- Airflow Meter (Anemometer) or a basic wind meter
- Temperature data loggers
Airflow Meters
You can go with a cheap and simple wind meter with a vane impeller to get started. We recommend the Kestrel 1000 Wind Meter. A similar brand should work well, too.
When you’re ready to upgrade to a true airflow meter, go with the Fluke 922 Airflow Meter for more accurate results and versatility.
Temperature Data Loggers
There are a wide range of temperature data loggers available. Just make sure to select one that can handle the maximum temperatures the oven can achieve. This is critical for the process.
We recommend the MadgeTech HITEMP140 High-Temperature Data Logger.
A few features to look for in a temperature data logger:
- Wireless and Programmable probes – this will allow you to fit in various locations and positions through the oven.
- Eye Loop – this will give you the ability to suspend the data logger with butcher twine anywhere on the truck if needed.
- Built-in Clocks and Timers – this will allow you to start and stop the data collection at given times and select how often the temperature data is collected.
Throughout this process, we recommend setting all the data loggers to start at the exact same time and collecting a temperature data point every 30 seconds to 1 minute.
Doing so will make it easier to compare the data side by side and will help you see smooth temperature increases or decreases without collecting an overwhelming amount of data to analyze.
Thermal Mapping and Balancing Process
The best way to start the thermal mapping and balancing process is in a cool and empty oven.
Turn the main blower fan(s) on manually to the highest velocity setting and move the dampers (if applicable) to where they push the maximum velocity to one side of the oven and the minimum velocity to the other side.
Step 1: Air Velocity Readings
Place the airflow meter right at the opening of the supply duct in the oven to take a reading, as seen in the image below.
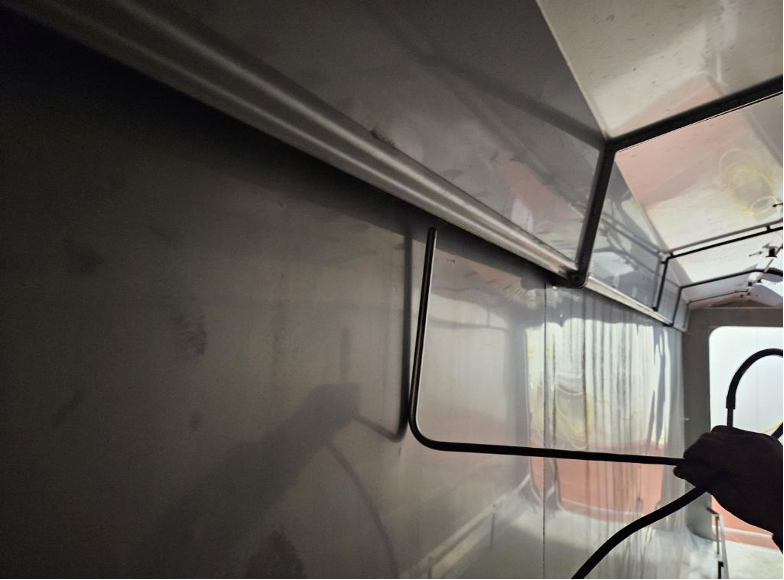
We recommend taking a reading in the middle of where each truck would be in the oven, or at equal distances along the oven duct openings.
If the oven has cones instead of slotted ducts, then start at one end of the oven, count over no more than 10 cones, and take the next reading.
Measure air velocity on both sides of the oven.
Then, move the dampers so the maximum velocity moves to the other side of the oven and repeat that process.
Finally, move the dampers to the middle so the velocity is equal on both sides of the oven. Repeat the process above.
If the oven doesn’t have the ability to stop the dampers at various points, then allow the dampers to continuously move and record the highest and lowest velocity at each location before moving to the next location in the oven.
Step 2: Temperature Readings
When you’ve finished with air velocity readings, it’s time to take temperature readings.
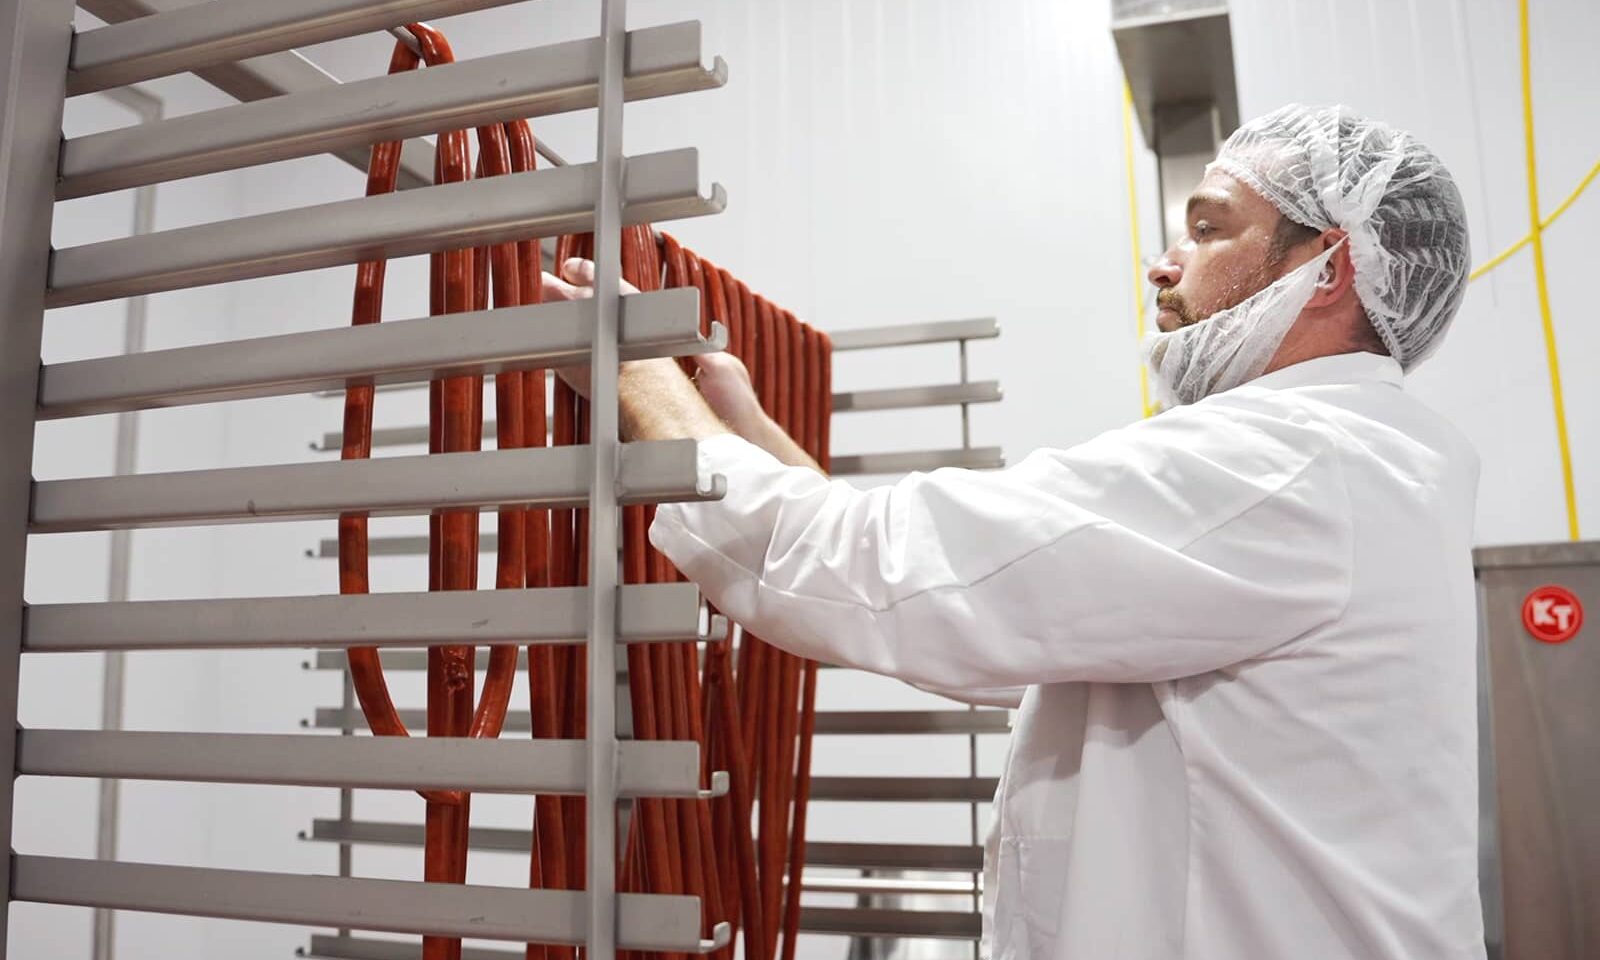
Begin by probing the product on the trucks with temperature data loggers and loading the oven.
We recommend:
- At least one data logger per truck
- Probes are in the exact center of the product
- Probes are placed in the same location from truck to truck throughout the oven
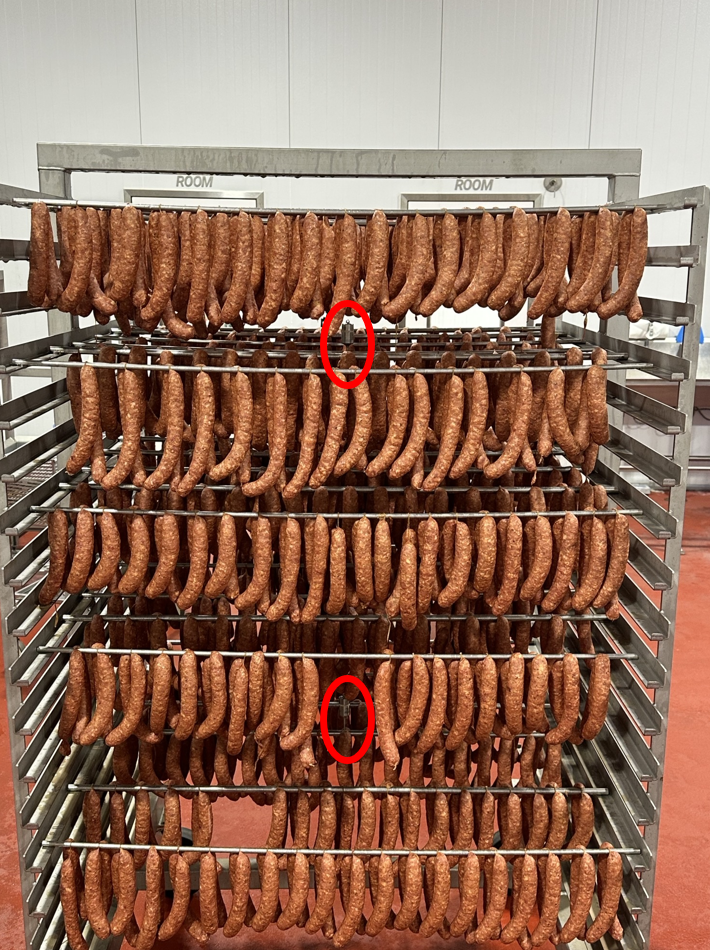
Placing the probes in the same location on each truck is important, especially for smaller-diameter items like smoked sausages and snack sticks.
The hot air moving across the product within a given breakpoint location is transferring it’s thermal energy causing the product temperature to increase. Other areas of the oven where the air isn’t moving as much can cause the product to have a slightly lower temperature at the same time.
It is best to compare probes within the same locations between trucks at the exact same times to determine if the temperature is balanced in the oven.
Depending on the number of probes available, this procedure should be repeated by placing probes in products at different locations until you are comfortable knowing if the oven temperature is balanced from top to bottom and side to side of each truck, as well as from front to back of the oven.
We also recommend noting the maximum internal temperatures reached through the entire oven during the process.
Step 3: Analyzing the Data
Once all the data has been collected, it’s time to start the analysis process.
Here are a few general rules of thumb to follow:
Air Velocity
A good oven should only have a 20% variance (or less) between the air velocities collected within a specific setting of either high, low, or equal airflows.
Temperature
The temperature variance should not exceed 2% at a given time or between the final lethality temperatures throughout the entire oven.
Map Your Ovens
Mapping and balancing your ovens is a critical step to ensure product consistency, yields, and throughput.
We recommend making it part of your preventative maintenance schedule so you can spot inconsistencies before they affect your product.
If you need assistance, our applications specialists are more than happy to answer your questions or arrange a mapping of your oven.
Contact us today to schedule a call.

